Introduction
Ever found yourself stuck over a project that feels like a jumbled mess? I sure have—there was this one time I was juggling deadlines, budgets, and a team that couldn’t agree on anything. Then I discovered Mike Clayton’s Periodic Table of Project Elements, and it was like a lightbulb moment! Created back in 2013 by this project management wizard, it’s a tool that organizes the chaos of projects into a neat, understandable grid, much like the periodic table we all remember from chemistry class.
Whether you’re a pro or a beginner into project management, this guide will show you how it can transform your approach. Here’s a quick tip to kick things off: start by listing your project’s core pieces using this table—it saved my bacon more times than I can count. Stick with me, and I’ll reveal why this is a game-changer!
Who is Mike Clayton?
With over 20 years of leading big projects and training folks globally, Mike Clayton penned 14 best-selling books, including How to Manage a Great Project, which I’ve practically worn out from reading. Based in the UK, he’s a trainer so in demand that his sessions fill up fast. In 2013, he introduced the Periodic Table of Project Elements, and it’s been a lifesaver for people like me ever since. Oh, and in 2016, he launched OnlinePMCourses—a platform that’s helped thousands, including me, level up their skills. I once joined one of his online workshops, and the way he broke down complex ideas left me buzzing with ideas for weeks!
What is the Periodic Table of Project Elements?
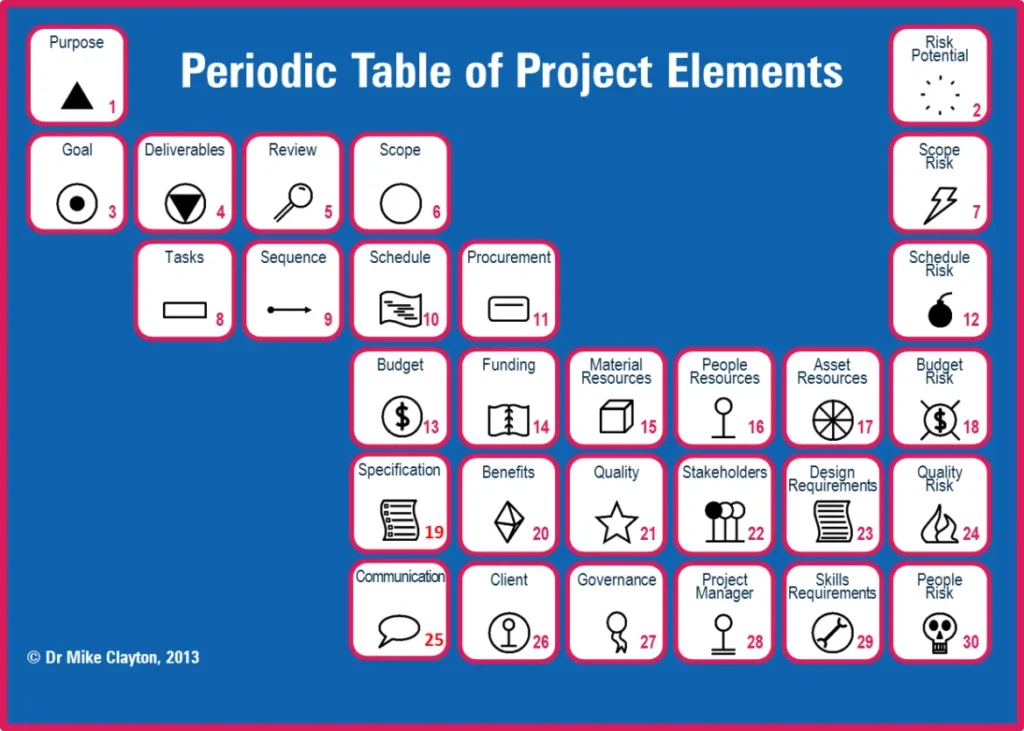
So, what’s the buzz about this table? Think back to chemistry class—remember how the periodic table laid out elements like Hydrogen or Oxygen in a clear, logical way? Mike took that concept and applied it to projects. His Periodic Table of Project Elements breaks down everything you need to manage a project into “elements” like Stakeholders, Budget, and Scope, all arranged on a blue grid with red borders that’s both eye-catching and easy to use.
Here’s the magic: just like you can’t break Hydrogen into something simpler, you can’t run a project without these core components. Mike calls them indivisible, and I’ve seen this play out. They team up to form “compounds”—think of the famous trio of Scope, Budget, and Schedule, often called the project management “triple constraint.” Last year, I was working on a marketing campaign with a tight deadline. When the client expanded the Scope, I used the table to see how it’d affect Budget and Schedule. A quick adjustment kept us on track—proof this tool works!
The table lists 30 elements, grouped into categories like Purpose, Tasks, Budget, Quality, and Risk Potential. It’s not just a pretty design—it’s a practical roadmap to keep your project humming along. I keep a printed copy on my desk, and it’s become my go-to for staying organized.
A Glimpse into the Project Management Periodic Table
Mike Clayton’s Periodic Table of Project Management, as depicted in his work, categorizes various project components, each with its unique symbol and atomic number, much like the scientific periodic table. Let’s explore some of these key elements and their roles:
- Sh (Stakeholders): These are the individuals or groups who are affected by the project or can influence its outcome. Their engagement and management are paramount to project success.
- Pm (Project Manager): The central figure responsible for planning, executing, and closing the project. Their leadership and decision-making are critical.
- C (Client): The primary recipient of the project’s deliverables and the ultimate arbiter of its success.
- P (Purpose): The fundamental reason for the project’s existence, defining its ultimate goal and strategic alignment.
- U (Users): The end-users of the project’s output, whose needs and feedback are vital for usability and adoption.
- Gl (Goal): The specific, measurable, achievable, relevant, and time-bound objectives the project aims to accomplish.
- En (Engagement): The process of involving and motivating stakeholders and team members throughout the project lifecycle.
- V (Value): The benefits and returns the project is expected to deliver to the organization or its beneficiaries.
- Pr (Principles): The guiding rules and fundamental truths that underpin the project’s approach and decision-making.
- L (Leadership): The ability to guide, inspire, and direct the project team and stakeholders toward common objectives.
- G (Governance): The framework of rules, policies, and processes that ensure the project is managed effectively and ethically.
- Sp (Sponsor): The individual or group who provides financial resources and support for the project, and champions its objectives.
- T (Tailoring): The process of adapting project management processes and methodologies to suit the specific needs of a project.
- Lf (Lifecycle): The sequence of phases a project goes through from initiation to closure.
- Pr (Processes): The systematic series of actions taken to achieve a particular result in project management.
- Mo (Monitoring): The continuous tracking and review of project progress against the plan.
- M (Measurement): The quantitative assessment of project performance and outcomes.
- To (Tools): The software, techniques, and instruments used to facilitate project management activities.
- Cx (Complexity): The degree of intricacy and interconnectedness within a project, influencing its management approach.
- Sc (Scope): The defined boundaries of the project, outlining what is included and excluded.
- Q (Quality): The degree to which the project’s deliverables meet specified requirements and stakeholder expectations.
- Bu (Budget): The financial resources allocated for the project.
- Co (Cost Control): The process of managing and controlling project expenditures to stay within the budget.
- Fu (Funding): The provision of financial resources for the project.
- B (Benefits): The positive outcomes and advantages realized from the project’s successful completion.
- De (Design Requirements): The detailed specifications and criteria for the project’s deliverables.
- Qm (Quality Management): The processes and activities used to ensure that the project meets quality standards.
- Dl (Deliverables): The tangible outputs or results produced by the project.
- As (Assets): The resources, capabilities, and infrastructure available to the project.
- Mt (Materials): The physical resources required for the project.
- Bi (Backlog): A prioritized list of features or tasks to be completed in an agile project.
- Pc (Procurement): The process of acquiring goods, services, or works from external sources.
- Su (Suppliers): External entities providing goods or services to the project.
- Ch (Change): The process of managing alterations to the project scope, schedule, or budget.
- Tr (Transformation): The process of implementing significant changes within an organization through the project.
- Ct (Contract Management): The administration of contracts with external vendors or suppliers.
- Cl (Collaboration): The act of working together with others to achieve a common goal.
- Cp (Capabilities): The skills, knowledge, and resources available to the project team.
- Dp (Dependencies): The relationships between project activities where one activity relies on the completion of another.
- Ts (Tasks): Individual units of work that need to be completed as part of the project.
- Rr (Risk Response): The actions taken to address identified project risks.
- Rt (Schedule Risk): The potential for delays or disruptions to the project schedule.
- Rb (Budget Risk): The potential for cost overruns or financial shortfalls.
- Rq (Quality Risk): The potential for the project’s deliverables to not meet quality standards.
- Rs (Scope Risk): The potential for changes or expansion of the project scope.
- Rp (People Risk): Risks associated with human resources, such as skill shortages or team conflicts.
- Cn (Contingency): Provisions made for unforeseen events or risks.
- Su (Sustainability): The long-term viability and environmental impact of the project.
Rv (Review): The process of evaluating project performance and outcomes.
Each of these elements, while distinct, is interconnected. A change in one element, such as an increase in scope (Sc), will inevitably impact others, like the budget (Bu) and schedule (S). This interconnectedness underscores the holistic nature of project management and the importance of considering all elements in unison.
Practical Applications: Making It Work for You
This table isn’t just a neat idea—it’s a hands-on tool I’ve used to turn projects around. Here’s how you can put it to work, based on my own experiences:
- Planning Made Easy: I treat it like a checklist. Before starting a project, I confirm Stakeholders (Sh) and Purpose (P) are crystal clear. It’s stopped me from diving in blind more than once.
- Spotting Risks Early: I scan for Budget Risk (Rb) when setting costs. Last month, I caught a potential overrun early and adjusted—saved the day!
- Talking It Out: Sharing the table with my team gives us a shared language. It’s amazing how a simple visual clears up confusion.
- Fixing Problems Fast: When a project lags, I trace it back. Was it Schedule (S) or People Risk (Rp)? Pinpointing the issue speeds up the fix.
- Big-Picture Thinking: It reminds me everything’s connected. Change the Scope, and Budget shifts too—holistic management at its best.
Downloading and Using the Table
Ready to give it a try? You can grab the PDF from Mike’s website or OnlinePMCourses. I downloaded mine years ago, and it’s been a constant companion. Here’s how I use it:
Reference Guide: A quick glance helps me remember key elements during planning.
Training Tool: I’ve used it to onboard new team members—visuals stick better than words!
Meeting Aid: Showing it to clients or stakeholders simplifies explaining the project’s backbone.
Tip from Me: Print it out and pin it up. It’s a daily reminder to think about those core pieces. I’ve even laminated mine—it’s that useful!
Advanced Tips for Mastering the Table
- Regular Check-Ins: Review the elements weekly. I do this on Friday afternoons—catches issues before they grow.
- Team Workshops: Run a session where your team maps a project using the table. It builds buy-in and uncovers blind spots.
- Risk Scenarios: Play “what-if” games. What if Scope Risk (Rs) hits? How do you adjust Budget (Bu)? It’s like a project stress test.
- Document It: Keep notes on how each element plays out in your projects. I’ve got a little journal going—it’s gold for future planning.
I tried the workshop idea on a recent project, and my team caught a Schedule Risk (Rt) we’d missed. We adjusted early, and it paid off!
Conclusion
Mike Clayton’s vision of project elements as a periodic table offers a refreshing and robust framework for understanding project management. By likening project components to indivisible chemical elements, he provides a powerful metaphor that simplifies complexity and highlights the foundational nature of each aspect. This analogy not only aids in systematic planning and execution but also fosters a deeper appreciation for the intricate interplay of factors that contribute to project success. As project managers, embracing this elemental perspective can lead to more effective strategies, better outcomes, and a more profound understanding of the art and science of project delivery.
Kickstart your project management journey—explore top PMI certifications now! Read the blog


